Analytics
Radio Mast Analytics provides enhanced daily listener statistics and reports for streams on the Radio Mast Streaming Network, helping you better understand your audience. Royalty reports are provided for radio broadcasters in the style required by various performing rights organizations.
Radio Mast Analytics includes a powerful interface for breaking down Listener Sessions by country, city, and player device. Each dimension can be filtered and further segmented, allowing you to see fine-grained information about your audience.
With Radio Mast Analytics, you can:
- Quickly see where your listeners are
- Discover how many unique listeners you have
- Compare your popularity in different cities and countries
- See which devices your listeners are using.
- Find out which websites or apps are referring your listeners
- Filter and drill down into your data (eg. see top devices in your city)
- Generate performance reports in the style of SoundExchange, ASCAP, BMI, and Re:Sound.
- Get playout metrics, such as total tracks played and total tracks played.
Here's some examples of how you can delve into the data from Analytics:
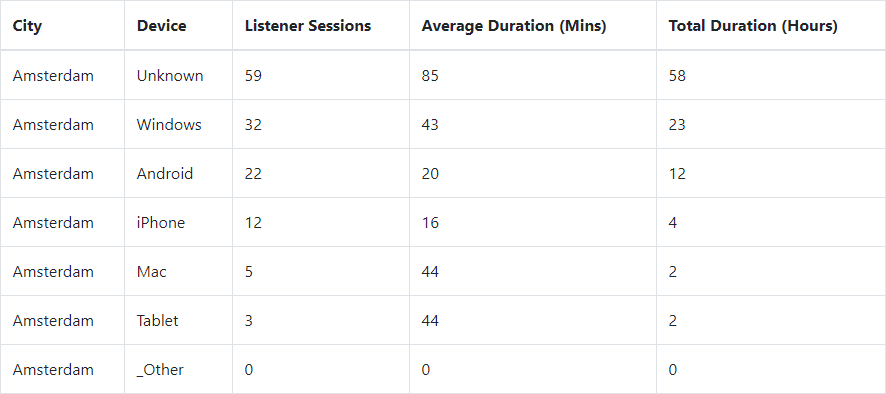
- Explore listener sessions from New York City, broken down by player device.
- Compare total listening hours by device, to understand how much time listeners spend on-the-go.
- Compare the average listening session length across cities, to assess the fitness of your radio content for the geography of your audience.
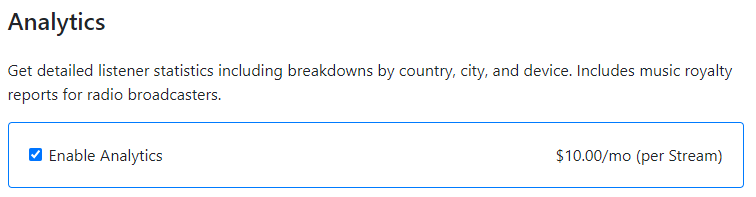
Analytics can be enabled on any Radio Mast stream for $10 / month. Learn more about pricing.
Enabling Analytics
To enable Analytics on an individual stream, log into Radio Mast then:
- Click Streams on the left.
- Click the stream you'd like to configure.
- Select the Configuration tab.
- Under Analytics, click Enable Analytics.
- Click Save Stream to apply your settings.
Data will begin to appear in Analytics within 1 - 2 hours after enabling it.
Listener Sessions
The Listener Sessions tab displays aggregated statistics about your listeners over a given data range. Statistics are presented as both a graph and table. A listener session is a single connection from a listener to the Radio Mast Streaming Network.
The following controls are available for filtering listener session data:
- Stream - View data for all streams or filter to a particular stream.
- Breakdown by - Choose a dimension to breakdown the data by (Country, City, Device, Referrer, or None)
- Filter by - Further filter the data by a particular value (eg. Listeners from the United States)
- Breakdown further - Apply a second dimensional breakdown to your data, after having filtered it down. (eg. Listener sessions by city in the United States.)

The graph displays the top 5 data series from the table, showing how your audience changed over the reporting period. The graph has a configurable time resolution of 15 minutes, 1 hour, or 1 day.
The following metrics can be displayed in the graph:
- Active Sessions - plots the number of listener sessions that overlap with each time interval.
- Uniques - plots the number of listener sessions from unique listeners that overlap with each time interval. A unique listener is considered a unique combination of user agent (device) and IP address.
- TLH - plots the total listener hours from active sessions that contribute to each time interval.
The table displays listener session breakdowns by the selected filters across the reporting period. Statistics include total active listener sessions, uniques, average session duration, and total duration (also known as total listener hours or aggregate tuning hours).
The table can also be switched to "Percentages" mode, which displays Total Duration and Listener Sessions as a percentage of their respective totals. For example, this allows you to see percentage of TLH by country.
Performances
The Performances tab displays how many times each track was aired on your radio stream (play count) and how many times it was heard by listeners (performances). If a single track is aired by your radio station and heard by 10 listeners, 10 performances are reported.
Performances can be filtered by an individual stream or aggregated across all streams on a station. Performances are reported monthly. Monthly performance data can be exported to CSV.
Additional metrics are available below the Performances table, and include total performances, tracks played, and tracks per hour for a given month.
Reports
Reports can be exported in the style used by performing rights organizations, including SoundExchange, BMI (Music Use Report), ASCAP, and Re:Sound. These are useful for licensed radio stations who need this data for royalty reporting.
SoundExchange Report
Radio Mast Analytics can generate reports in the style required by SoundExchange, based on your performance data. Performances are filtered for US listeners only, calculated based on the fraction of daily US total listener hours (TLH).
Extended Metadata is required for complete SoundExchange-style reports. The following metadata fields are required:
ArtistTitleYearLabel- Alternatively:
ISRC, instead ofYearandLabel.
Additionally, the "Service Name" column must be manually filled out. For more information about SoundExchange reporting requirements, please consult your agreement with SoundExchange.
ASCAP Report
ASCAP-style quarterly reports can be generated with Radio Mast Analytics.
Note that the "Service Name" column must be manually filled out before submitting your report.
BMI Music Use Report
Quarterly reports in the style of a BMI Music Use Report can be generated by Radio Mast Analytics.
Re:Sound Report
Monthly reports in the style of Re:Sound can be produced for your station by Radio Mast Analytics.
Extended Metadata is required for complete Re:Sound-style reports. Specifically, the Label field must be provided by your encoder,
in addition to the traditional Artist and Title fields.
Corporation for Public Broadcasting Report (CPB)
Analytics can generate reports in the style used by Corporation for Public Broadcasting for SoundExchange, consisting of raw listener session logs. To access these reports for your station, you must enable Generate and archive monthly CPB reports in the Settings tab of Analytics. CPB reports are generated on the 1st of every month and reports for subsequent months will only be available after this setting is enabled.
PPL Report
Radio Mast Analytics does not have a PPL-style report, but the information needed for some types of broadcasters is readily available in the following parts of the interface:
- Listener Sessions tab:
- Percentage breakdown of listener hours by country - Click the Percentages tab above the table to view.
- Total listener hours (TLH) per month or quarterly period - Clear the Breakdown and Filter selections to see TLH across all listeners and adjust the reporting period accordingly.
- Performances tab:
- Average number of tracks webcast per hour
Summary of Reports
| Report Style | Period | Metadata Required | Notes |
|---|---|---|---|
| SoundExchange | Monthly | Extended Metadata: Artist, Title, Year, Label (or ISRC) | NAME_OF_SERVICE and CHANNEL_OR_PROGRAM_NAME columns must be manually filled out. Performances are filtered to US listeners only. |
| ASCAP | Quarterly | Basic Metadata: Artist, Title | "Service Name" column must be manually filled out. "Number of Performances" is equivalent to our "Play Count". |
| BMI Music Use Report | Quarterly | Basic Metadata: Artist, Title | "Performance Count" is equivalent to our "Play Count". |
| Re:Sound | Monthly | Extended Metadata: Artist, Title, Label | "Number of Plays" is equivalent to our "Play Count". |
| Corporation for Public Broadcasting | Monthly | Basic Metadata: Artist, Title | Bot traffic and sessions shorter than the *Minimum Listener Session Duration* setting are excluded. *Generate and archive monthly CPB reports* setting must be enabled first. |
Bots and Filtering
Radio Mast Analytics filters known bot traffic into a Device category called Bot, which can be explored in the Listener Sessions tab.
Radio Mast Stream Monitoring is filtered out from all Analytics statistics.
Custom Referrers
Your stream URL can be customized to override the "Referrer", allowing you to attribute and segment traffic to sources like apps
by using a different stream URL for each app. This is done by appending a referer=value querystring to your URLs. (Note
that referer is spelled with a single "R", in keeping with HTTP conventions.)
For example, this URL illustrates how to override the referrer with "TuneIn":
https://streams.radiomast.io/mymount?referer=TuneIn
Listeners that connect via this link would be accounted for in Analytics with their referrer as TuneIn, allowing you to easily track traffic from that source.
Settings
The following options can be configured in Analytics, under the Settings tab:
- Minimum Listener Session Duration (seconds) - Listener sessions shorter than this duration are excluded from Analytics data processing (Listener Sessions tab). By default, this value is 5 seconds. This setting does not apply to performance reports, except for SoundExchange.
- Exclude Bots - Listener sessions that are identified as known bot traffic will be pre-filtered and discarded from Analytics if this setting is enabled. Recommended.
- Generate and archive monthly CPB reports - Enable access to Corporation for Public Broadcasting reports. Must be enabled in the month before you need these report, as reports are generated on the 1st of each month.
Frequently Asked Questions
What does "Unknown" mean in the Listener Sessions table?
It is not always possible to accurately determine the location of a listener. In these cases, a listener's city or country may be labelled as Unknown.
For example, if Analytics is able to geolocate a listener's country but not their city, their city is labelled as "Unknown".
How often does data refresh?
Analytics data refreshes approximately every 15 minutes, depending on your listener volume.
CPB reports are generated on the 1st of every month, if enabled in the Settings tab.
I need an additional report not listed here.
Need a report that we don't have? Please get in touch and let us know what you need.
Does this use cookie-based tracking?
No, Radio Mast Analytics does not use tracking cookies.
Can I see TLH by country?
Yes, the Listener Sessions tab allows you to see a breakdown of TLH (aka. ATH) by country.
What timezone is the data displayed in?
Data is displayed in your local timezone, which can be configured in your User Profile. If you're viewing a station that has been shared with you by another user, data is displayed in the station owner's timezone.
Other Questions
Have another questions not answered here? Please get in touch and we'd be happy to help.